

■作者:ABLE LI 2023-06-10
几点说明
- 原始数据均来自TMLS, 不包括发生在TMLS之外的房产交易。
- 每月简报是基于上个月最后一天的TMLS数据分析的。
- 所有的文字和数据分析均为我个人观点。
- 未经许可,不得转载
- 扫码关注:
01. 概述
总体看房市还没有出现异动。先看看大势:
1.中位售价:五月的中位售价同比下降0.78%,连续六个月同比下降,但下降幅度非常小,几乎达到了去年同期水平。环比上升3.24%,在正常的季节性上扬范围之内。今年的房价虽然低于去年的水平,但还是远远高于2019,2020和2021的水平。
2. 交付量:受季节性影响,交付量比今年四月明显增加,但比去年同期有较大幅度下降。
本月的过户数量为4227, 比去年同期减少了6.25%,比上个月增加了16.03%。中位售价为382K, 同比下降了0.78%,环比回升了3.24%。新屋交付量为1187, 同比上升了41.99%,环比上升了6.17%。而在市天数为21天,同比上涨了117.98%,环比减少了22.22%。
去年同期比较
| 项目 | 2023 五月 | 2022五月 | +/- |
| 过户数量 | 4227 | 4509 | -6.25% |
| 中位售价 | $382,000 | $385,000 | -0.78% |
| 新屋销售 | 1187 | 836 | +41.99% |
| 在市天数 | 21 | 10 | 117.98% |
与上个月比较
| 项目 | 2023四月 | 2023 五月 | +/- |
| 过户数量 | 3643 | 4227 | +16.03% |
| 中位售价 | $370,000 | $382,000 | +3.24% |
| 新屋销售 | 1118 | 1187 | +6.17% |
| 在市天数 | 27 | 21 | -22.22% |
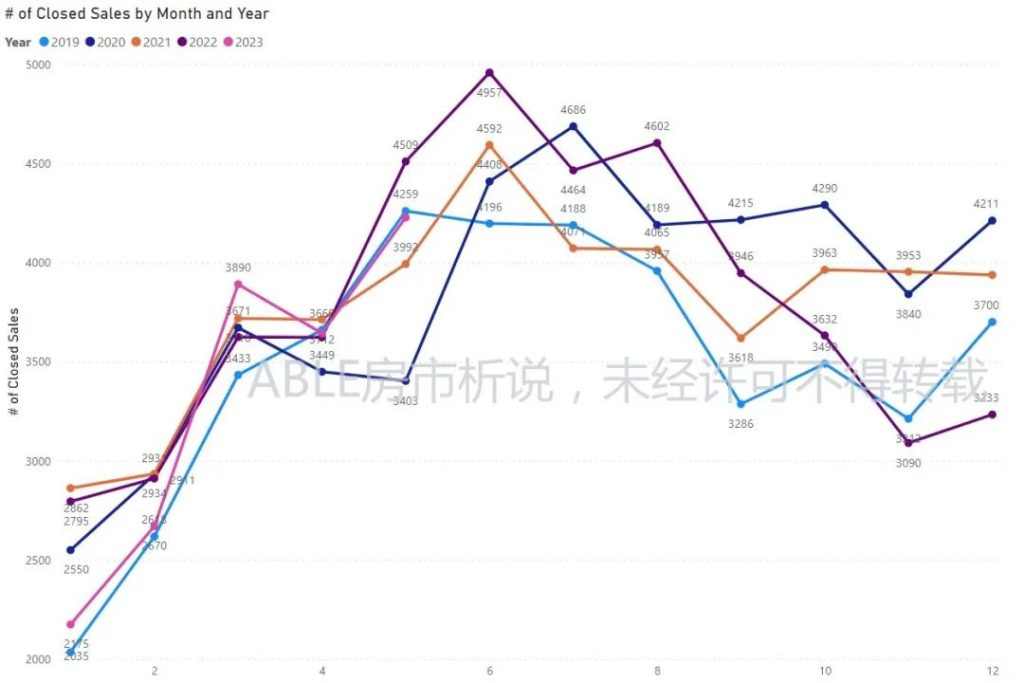
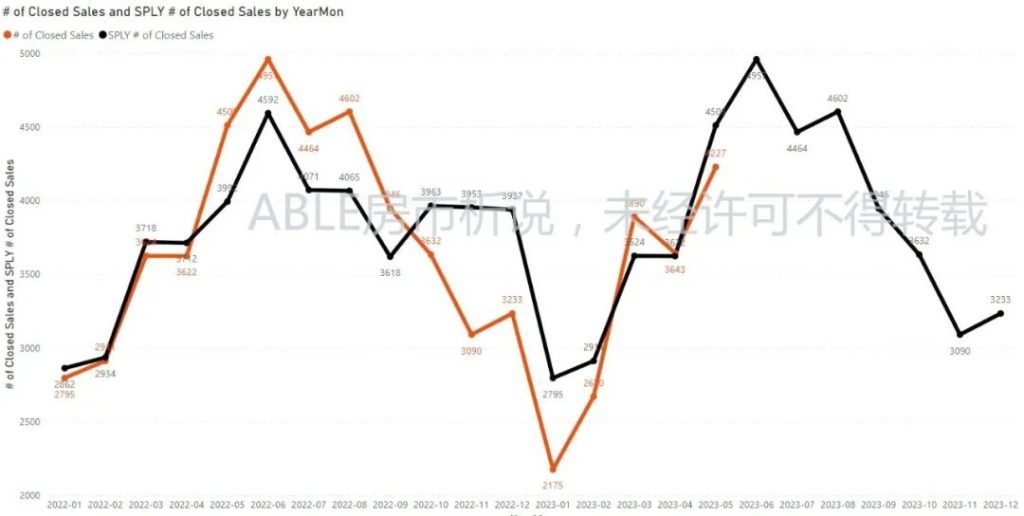
02. 房屋成交量
本月过户数量同比下降了6.25%,环比上升了16.03%。下图中桔色线是今年数据,而黑色的是去年同期数据。
Raleigh,Durham, Cary, Chapel Hill 和Apex的交易金额已经不足占整个交易量的一半。Raleigh以前几乎是整个金额的四分之一。现在不足20%。Fayetteville的交易异常活跃。
与上个月相比,大部分RTP中心区域的大部分城市的交付量都有大幅提高。
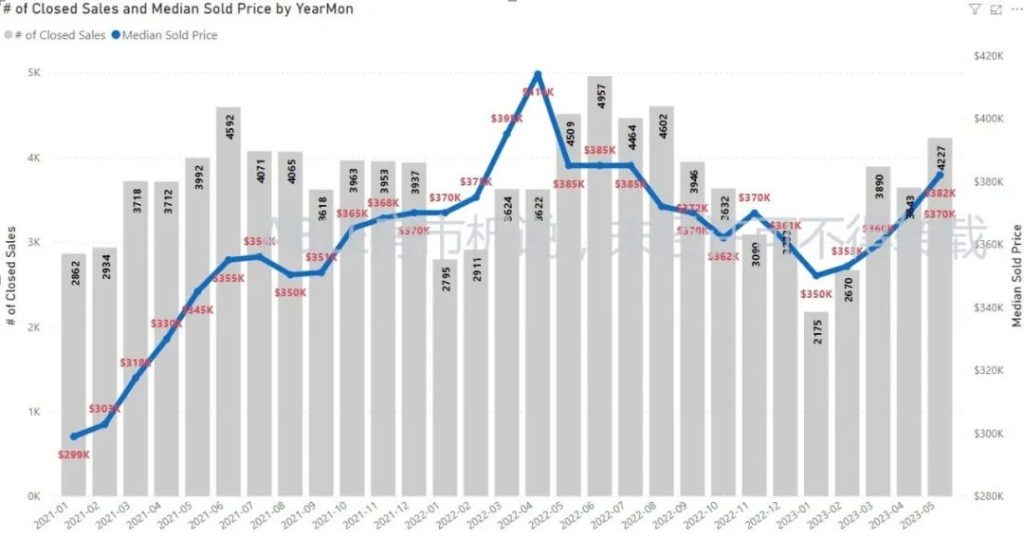
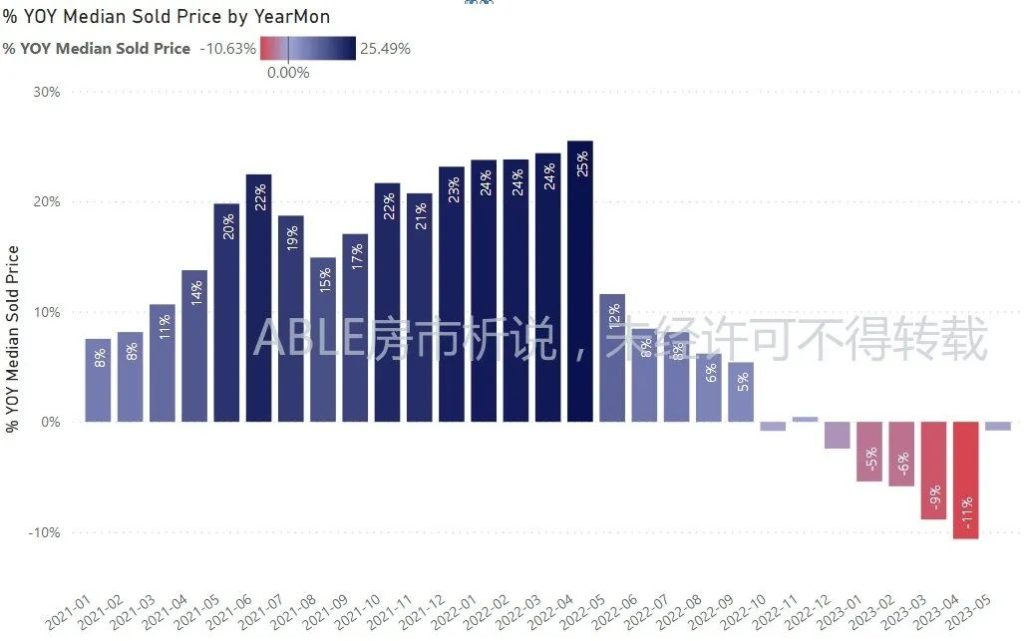
03. 中位售价
本月的中位售价为 $382k。同比继续下降,但幅度大幅减少,环比则上升3.24%。
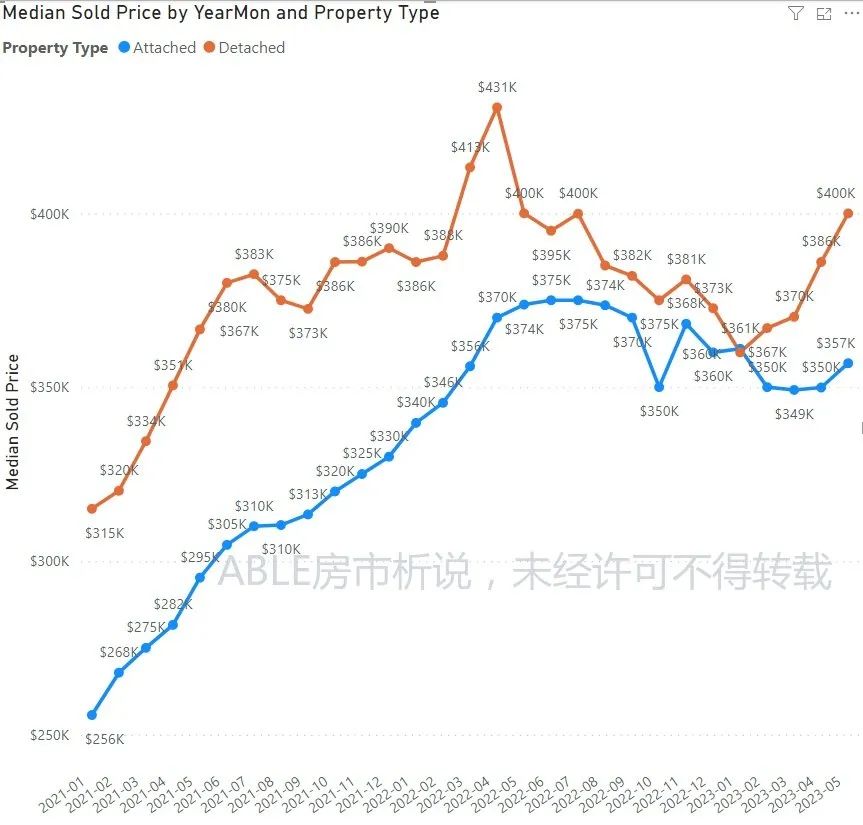
独立屋和联排屋的价格都有回升。
桔色为独立屋,浅蓝色为联排屋
每平方英尺中位售价继续回升。
与上个月相比,部分RTP中心城市的中位售价有所回升
04. RTP周边城市新屋销售
(由于很多新屋是期房,至少需要大约六个月左右的建造时间,所以现在新屋交付可能反映的是今年四五月份成交的情况)
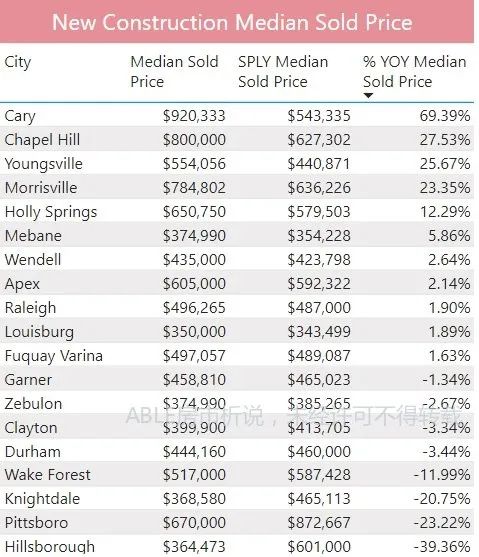
本月新房交付量为1187, 同比上升了41.99%,环比上升了6.17%。值得注意的是新房占比大幅上升。价格下降幅度加大。
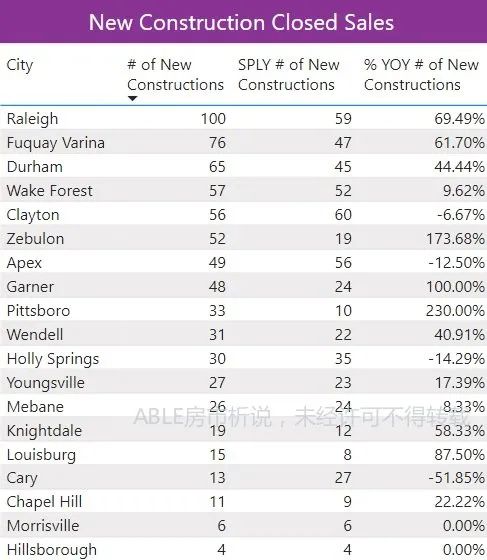
由于交易量太少,有些城市的中位售价统计上可能不够充分。‘’
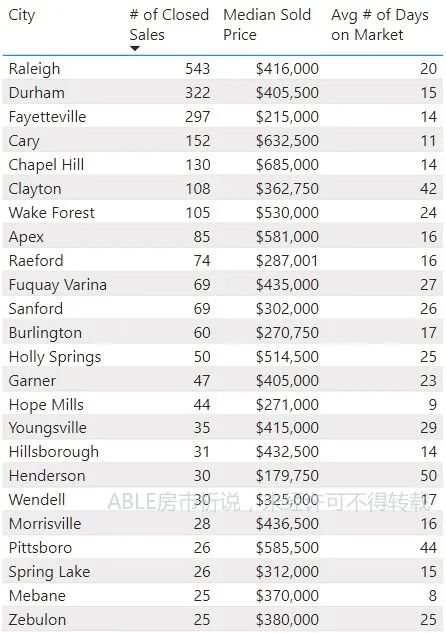
05. 二手房销售
二手房的交易量同比下降了17.23%, 中位售价下降3.18%。除了少数几个城市外,大部分城市无论交易量还是中位售价同比都有不同程度的下滑。
交易金额同比也大幅下降
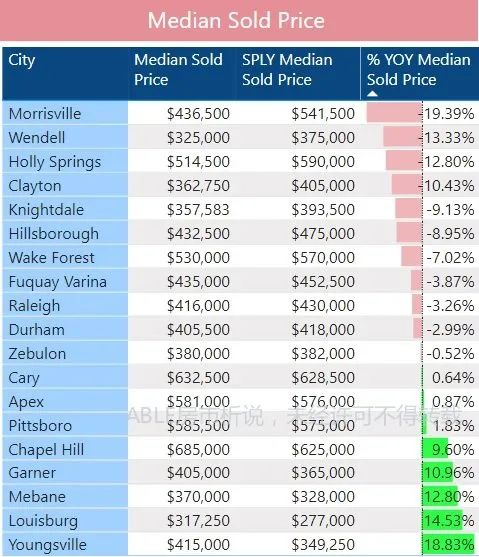
Raleigh, Cary,Apex等城市的中位售价同比下降
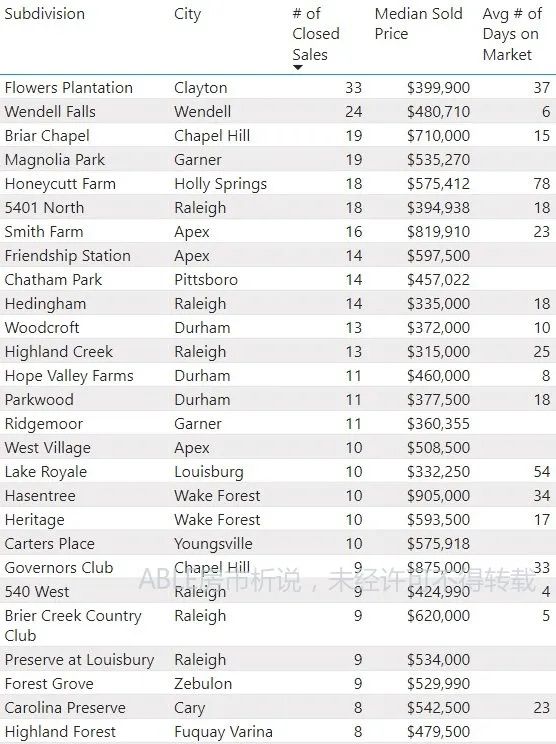
06. 部分小区详情
下表为部分RTP地区本月月份交易最活跃的小区。
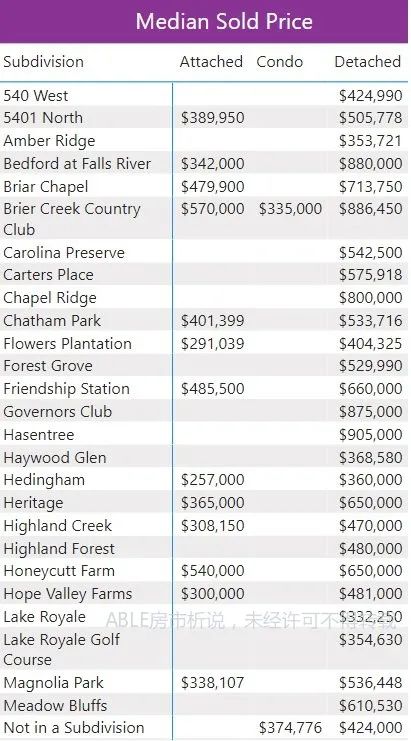
下图是各个小区不同户型的中位售价(仅供参考)。
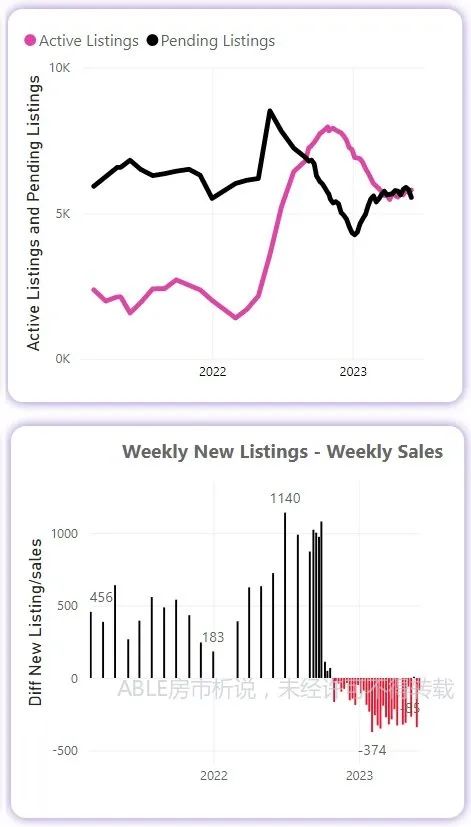
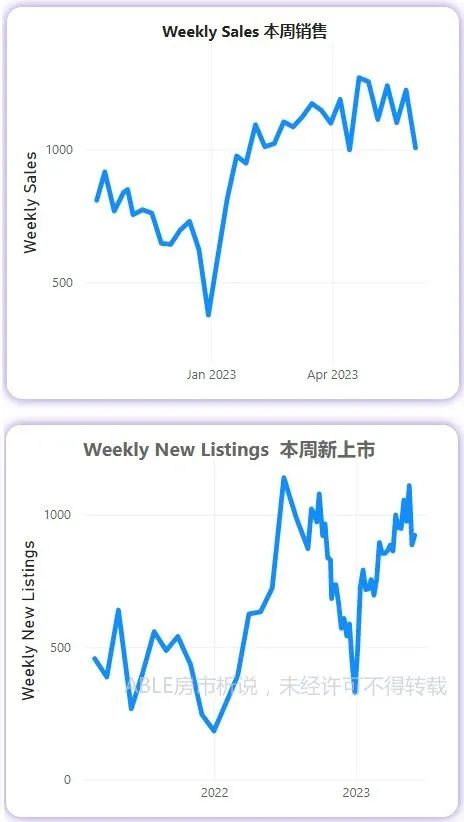
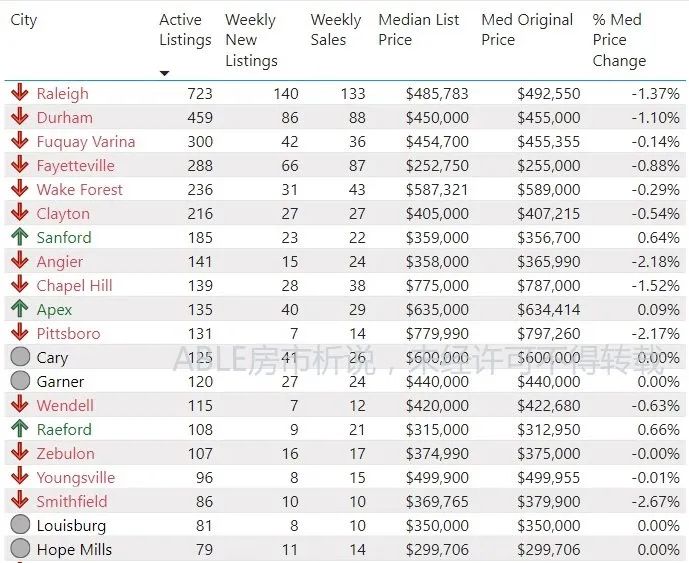
07. 库存
06/02/2023的库存为5793,比上个月的5552上升了4.34%。Weekly Sales 都趋于平缓,而Weekly New listings 略有上升趋势。估计库存水平回继续上升。
中位标价趋于平缓
下表中加入了上月中位售价和目前list price的比较。目前几乎所以城市的listing price 都高于sold price

下表是各个城市的详细情况。
08. 买房要讲价多少
Durham, Cary, Chapel Hill, Apex等城市由出现很多加价买房的现象。
下面是本月成交房屋的加价情况。
下表是部分小区的成交加价情况(仅供参考)。
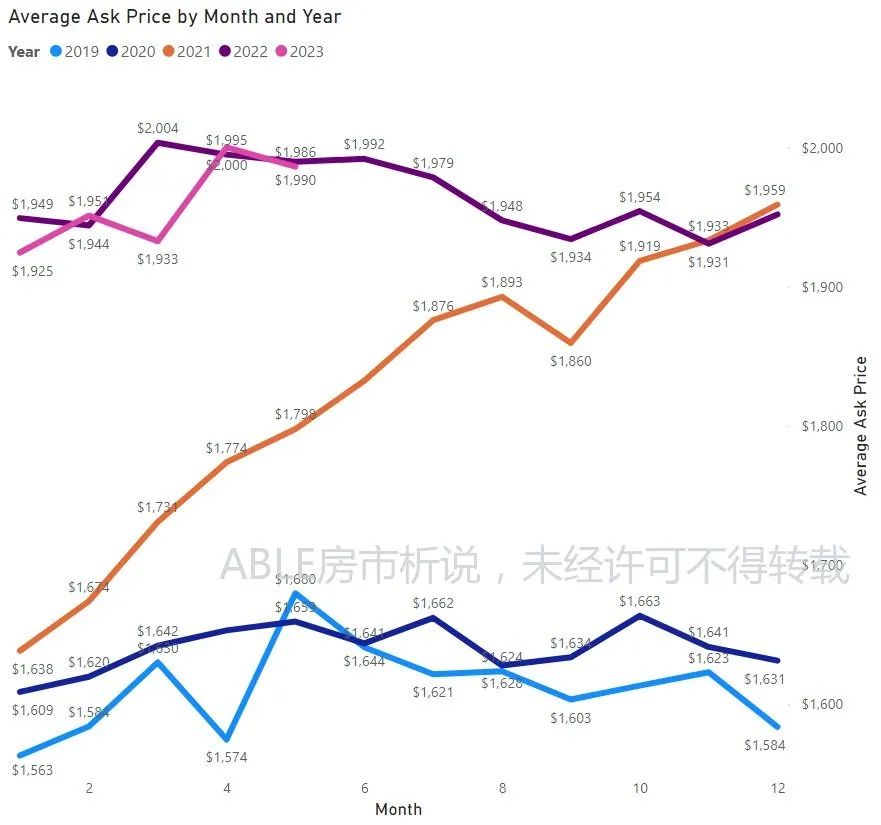
09. 出租屋
出租量:Active Listing(粉色)还是远远高于Rented (深蓝色)。
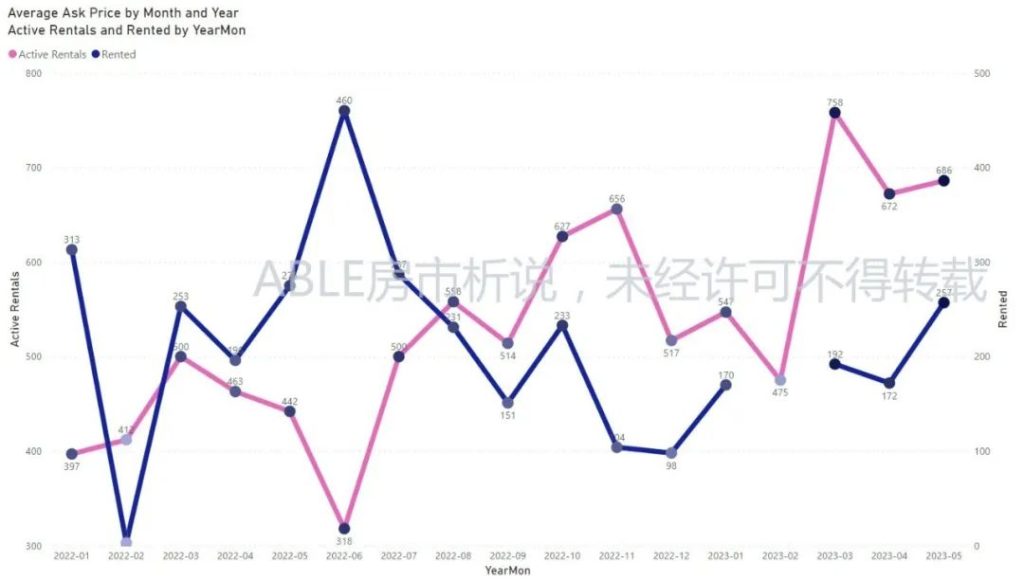
出租价格:本月asking price 低于上个月的水平,但还是远远高于前几年的同期水平。
以下是RTP中心区域附近的出租情况